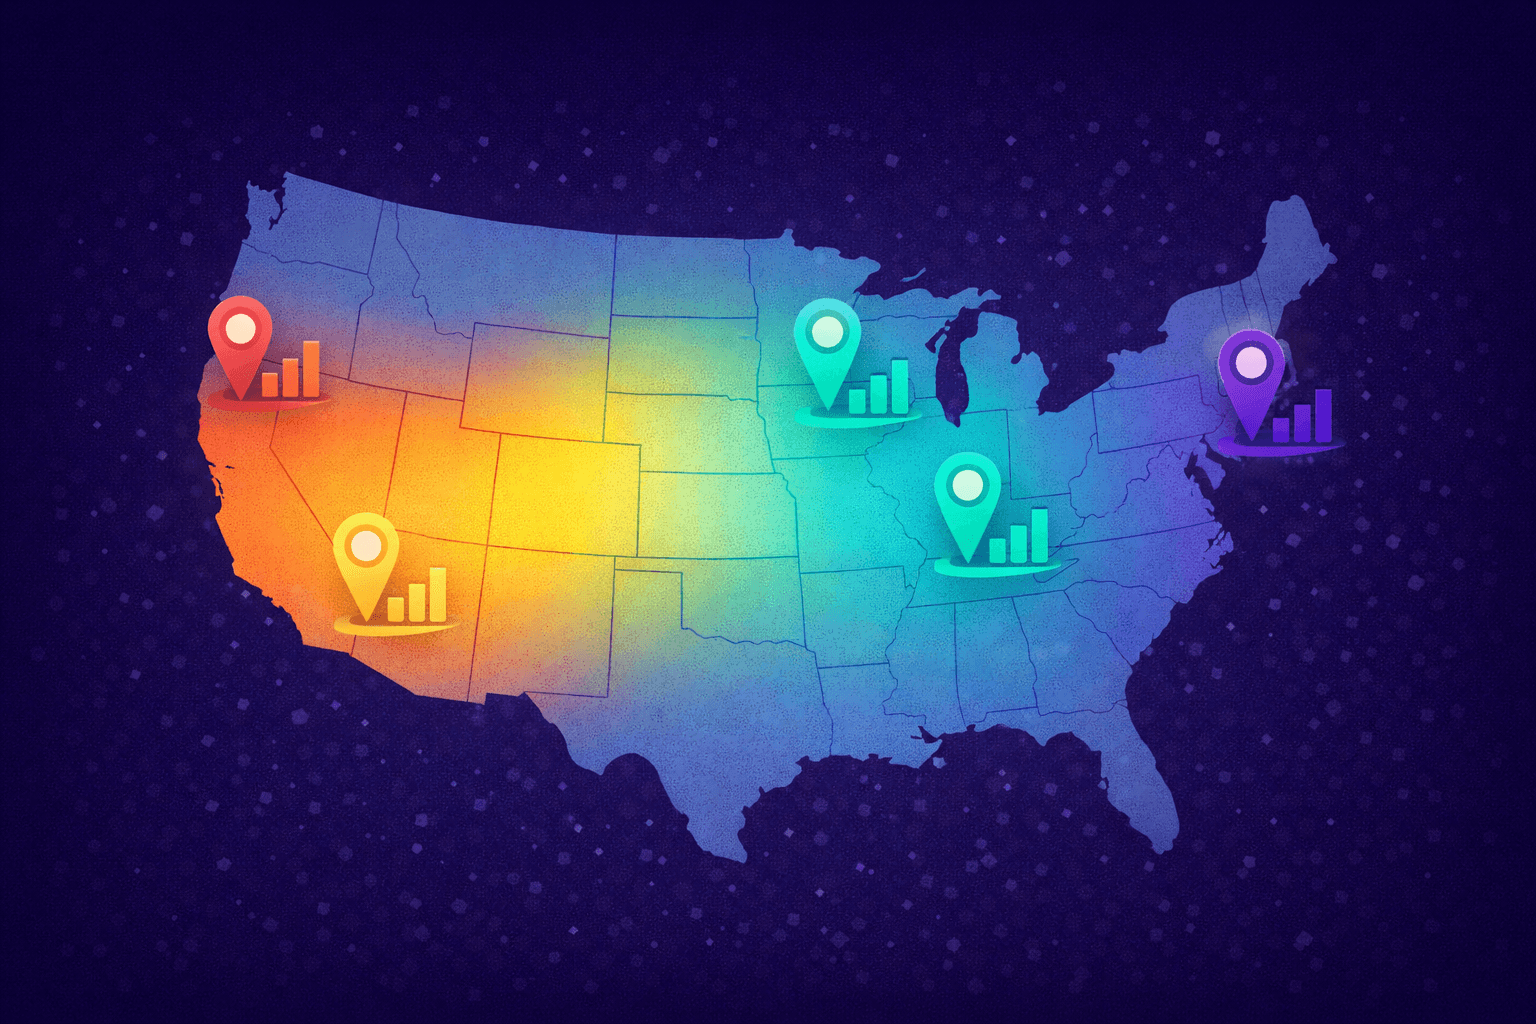
Five Markets Where Renters Need Equity Most
We ranked US cities by rent burden and homeownership gap. These five metros are where rent-to-equity models could make the biggest difference.
Measuring the Need
Not every housing market is equally broken. Some cities have tight supply but wages that keep pace. Others have a mismatch so severe that renting becomes a permanent wealth drain for the majority of residents.
To identify where rent-to-equity models are most urgently needed, we looked at three factors:
- Rent burden rate — the percentage of renters spending more than 30% of income on housing
- Homeownership gap — the difference between the local homeownership rate and the national average (roughly 66%)
- Rent-to-income trajectory — whether the gap between rent growth and wage growth is widening or narrowing
When all three indicators point in the wrong direction, you have a market where renters are losing ground fast — and where converting even a small portion of rent to equity could change outcomes for thousands of families.
Here are the five metros that stood out.
1. Miami, Florida
The Numbers
- Rent burden rate: 57% of renters are cost-burdened
- Median rent (1BR): $2,100
- Homeownership rate: 47% (19 points below national average)
- Median renter income: approximately $38,000
Why It Tops the List
Miami combines explosive population growth with a housing supply that has not kept up. Remote workers from higher-cost cities moved in during and after the pandemic, pushing rents up by more than 30% in two years. Meanwhile, local wages in hospitality, healthcare, and service industries have barely budged.
The result: more than half of Miami's renters are paying an unsustainable share of their income for housing, and the homeownership rate sits nearly 20 points below the national average. For a renter earning $38,000, the gap between their annual rent ($25,200) and any realistic path to a down payment is enormous.
Equity impact: At $2,100 per month, a 10% equity credit equals $210 per month — $2,520 per year. Over five years, that is $12,600 in accumulated equity from rent payments alone.
2. Los Angeles, California
The Numbers
- Rent burden rate: 55% of renters are cost-burdened
- Median rent (1BR): $2,300
- Homeownership rate: 45% (21 points below national average)
- Median home price: approximately $950,000
Why It Ranks
Los Angeles has the lowest homeownership rate of any major US metro. The median home price approaches $1 million, which means a 20% down payment requires $190,000 in savings. For a household earning the area median income, saving that amount while paying $2,300 per month in rent is virtually impossible.
Rent control protections exist but only cover a fraction of units, and new construction overwhelmingly targets the luxury segment. The city produces about 15,000 new housing units per year against demand for roughly 50,000.
Equity impact: At $2,300 per month, a renter accumulates $2,760 per year in EQT credits. It will not close a $190,000 down payment gap alone, but it creates a wealth-building mechanism that currently does not exist for LA's 2.3 million renters.
3. New York City, New York
The Numbers
- Rent burden rate: 53% of renters are cost-burdened
- Median rent (1BR): $3,200 (Manhattan), $2,400 (outer boroughs)
- Homeownership rate: 33% (33 points below national average)
- Renter population: approximately 5.3 million people
Why It Ranks
New York has the lowest homeownership rate of any city in America. Two-thirds of New Yorkers rent, and more than half of them are cost-burdened. The city's rental market is the largest in the country, with 3.4 million rental units — and demand still exceeds supply.
Public housing waitlists stretch 8-10 years. Rent-stabilized apartments are increasingly rare as buildings age out of the program. Market-rate rents in the outer boroughs have caught up to what Manhattan charged a decade ago.
Equity impact: Even in the outer boroughs at $2,400 per month, 10% equity yields $2,880 per year — $14,400 over five years. For a city where 5.3 million people rent with no path to ownership, converting any portion of that monthly expense into equity is meaningful.
4. Orlando, Florida
The Numbers
- Rent burden rate: 54% of renters are cost-burdened
- Median rent (1BR): $1,700
- Homeownership rate: 51% (15 points below national average)
- Wage growth (5-year): 12% vs. rent growth of 35%
Why It Ranks
Orlando might surprise people on this list. It is not San Francisco or Boston. But that is precisely the problem — wages here are lower while rents have surged. The metro's economy depends heavily on tourism and hospitality, industries where median wages hover around $35,000 per year. When rents were $1,200, that was tight but manageable. At $1,700, it is unsustainable.
The wage-to-rent growth divergence is one of the worst in the country: rents have grown nearly three times faster than wages over the past five years.
Equity impact: At $1,700 per month, 10% equity generates $2,040 per year. For a household earning $35,000, that annual equity accumulation represents nearly 6% of their total income — wealth they would otherwise never see.
5. San Diego, California
The Numbers
- Rent burden rate: 51% of renters are cost-burdened
- Median rent (1BR): $2,200
- Homeownership rate: 50% (16 points below national average)
- Median home price: approximately $875,000
Why It Ranks
San Diego combines California's restrictive zoning and high construction costs with a military and service-economy workforce that earns considerably less than the tech-driven metros up the coast. The result is a market where half of all renters are burdened and the median home requires a down payment of $175,000.
New housing production has averaged about 7,500 units per year against a regional housing authority estimate that 17,000 per year are needed. The shortfall accumulates year over year, pushing prices further out of reach.
Equity impact: At $2,200 per month, a renter builds $2,640 in annual equity. Combined with governance rights through a DAO structure, renters gain both financial stake and decision-making power over their housing.
The Pattern Behind These Markets
Every city on this list shares the same three structural problems:
- Housing supply has not kept pace with demand. Zoning restrictions, construction costs, and land scarcity limit new development.
- Rent growth has outpaced wage growth. The gap between what people earn and what they pay for housing widens each year.
- Traditional homeownership is out of reach. Down payment requirements create a barrier that no amount of budgeting can overcome for moderate-income renters.
In all five markets, a rent-to-equity model addresses the third problem directly. It does not pretend to solve the supply crisis, but it ensures that the rent people are already paying starts building something for them.
What Comes Next
Built By DAO is evaluating these and other markets for our first wave of community-owned housing developments. Our model works best in metros where strong rental demand meets a deep homeownership gap — exactly the conditions described above.
Bring Equity to Your Market
If you live in one of these cities — or any market where rent feels like money disappearing — the rent-to-equity model exists to change that equation. 10% of every payment becomes yours.
Join the waitlist to bring Built By DAO to your city, or explore investment opportunities in community housing development.
Related Posts

Why Smart Investors Are Choosing Community Housing
Community-owned housing offers attractive risk-adjusted returns alongside measurable social impact.

Renting in Chicago While Wealth Stays Out of Reach: What Income Inequality Costs You
Chicago's income gap isn't just a statistic — it shapes where people live, what they can afford, and whether they ever build wealth. Here's what that means for renters, and what's changing.
Housing Policy Changes That Could Unlock Affordability
From zoning reform to LIHTC expansion, these policy changes could make housing more affordable — especially when combined with private innovation.